I am building a personal data profiler: a system that collects parts of my digital footprint and helps me make sense of them. That sounds creepy, and it should. Most profiling systems are creepy because they are built by someone else, for someone else’s incentives. They turn our behaviours into predictions for ads, feeds, and retention loops. I’m interested in a different version - profiling as a way to understand myself, helping me gauge whether my intentions and my attention are aligned.
Because we use different cloud services, our own digital footprint is highly scattered - bank portals, Chrome browser, Garmin, YouTube, Goodreads etc. So, the first challenge is simply getting the data into one place and normalizing it. To enrich and categorize the free-form text in the data, traditionally would have involved supervised Natural Language Processing (NLP) models and doing that on your own data would have been very difficult. However, we are at a point in our LLM technology, where these NLP tasks can often be handled with few-shot prompts. Especially, if we can build the profiler using local LLM models, we will have a system that is confined to a boundary that we control and understand what it is doing. In the past I have built expense reporter based on my credit card and bank statements. Now, I have worked on building insights from my browsing history.
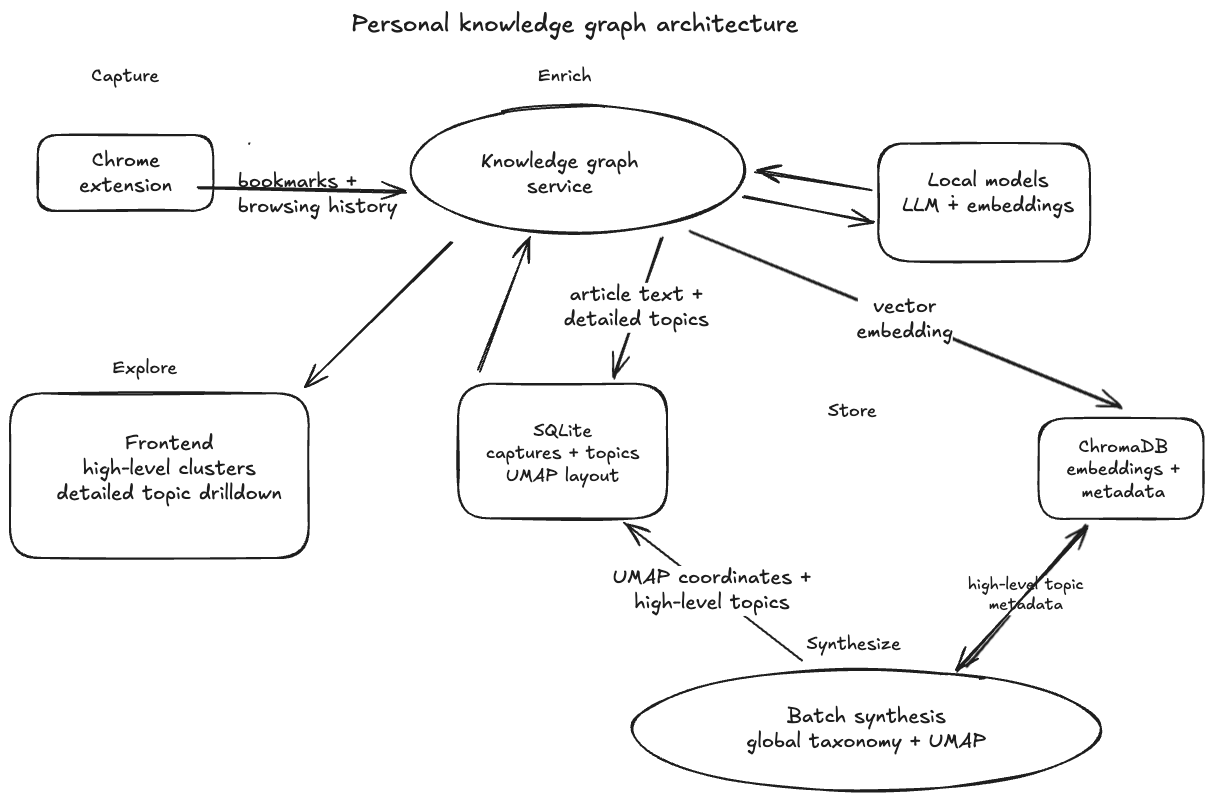
The architecture for the browsing history profiler at a high level is same as what I talked about in my post on Anatomy of a Data Product. The interesting part in this pipeline is that high-level topics are not assigned one page at a time. They are synthesized globally from the full browsing corpus, so the taxonomy reflects my actual library rather than a generic topic list. The main four stages of the data pipeline are:
- Capture: A Chrome extension sends bookmarks and browsing history to the service.
- Enrich: The service extracts article text, detailed topics, and vector embeddings.
- Store: SQLite keeps captures, topics, high-level topics, and UMAP coordinates. ChromaDB stores embeddings and metadata.
- Synthesize: A batch job builds a global taxonomy and computes the graph layout.
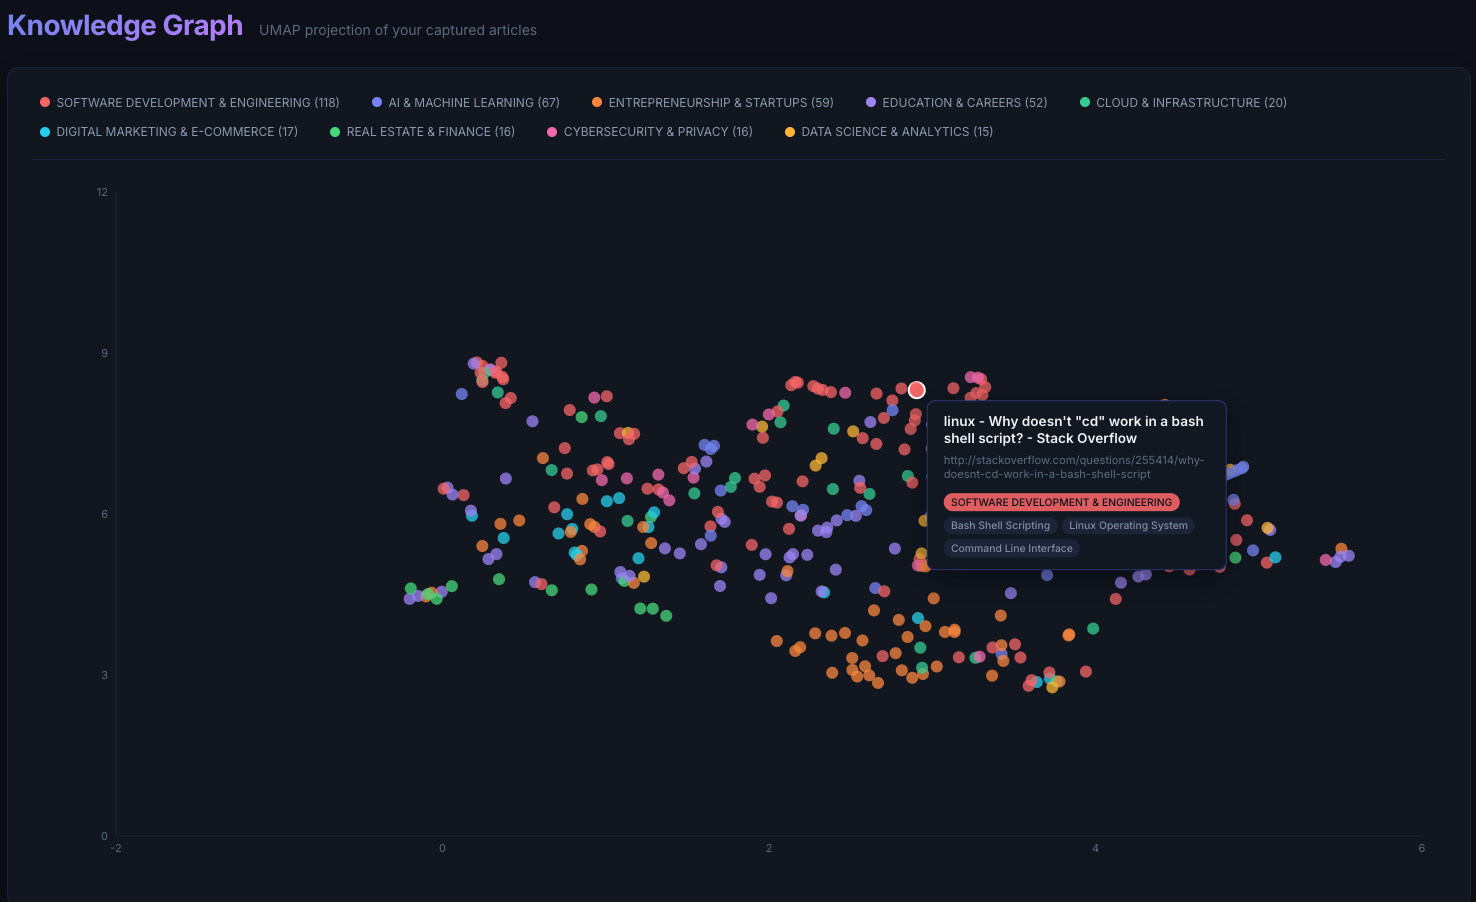
To explore my browsing and bookmarks data, I have a simple React frontend where each node in the graph represents one page, and nodes are clustered based on their text semantics, and high-level and low-level topics make it easy for me to zoom in. Looking at the graph, I can see that software engineering and AI dominate my reading. Entrepreneurship shows up as a meaningful secondary cluster. These top topics don’t surprise me as much. But, some areas I generally care about, like travelling, parenting, tennis are much thinner or non-existent. That gap is useful: the system is not just reflecting my interests, it is showing me where my attention and my intentions diverge.
To protect my privacy, the screenshot below uses a deliberately biased sample.
I would like to continue building these profilers that make sense of our own digital footprint in different domains, and aim to gain meaningful insights and recommendations that balance likeness and serendipity. I also think a lot more interesting insights would come out if we can cross-correlate the data from different verticals - Finance, Health, Reading, Media etc.
Personalization does not have to belong to platforms. With local models and local data, we can build profilers that serve self-understanding and can act as an assistant that keeps the user’s best interests in mind.