I define a Data Product as an application where the data itself is the primary feature, not just a byproduct. In these products, the UI serves mainly as a wrapper to filter, search, and visualize the underlying dataset. A few examples that fit in this definition are Business Intelligence Dashboards, Web Search interfaces, Credit scores in banking app.
The key components I see in building a Data Product are:
- Data Pipelines - Usually offline jobs, that pull raw data from various sources and transform to domain objects
- Database - Stores the data
- Relevance Engine- Algorithms that help the user discover relevant data. For example, Netflix’s recommendation algorithm would surface a handful of titles among say million other options.
- Service layer + UI - APIs that serves the data to match with user’s intent. And UI to capture user’s intent and present relevant data.
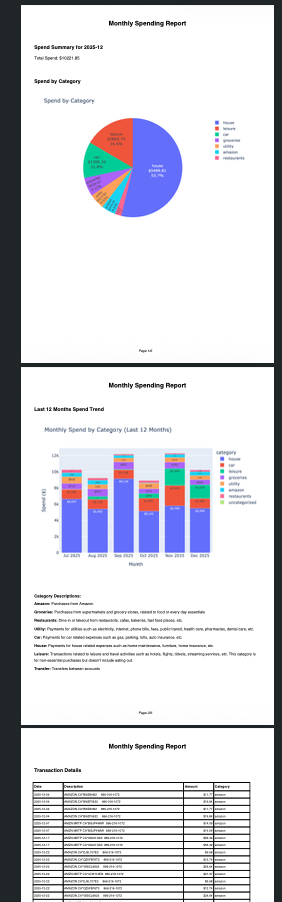
I would like to talk about the above components, by walking through the Categorized Expense Report that I wrote for my own use.
Data Pipelines
The offline jobs that I wrote for ingesting and processing my bank and credit card statements are:
1) CSV parsers to parse different bank and credit card statements to put in standardized data model
2) Keyword based categorizer and categorizer using Local LLM, figures out a pre-defined category for any financial transaction.
3) Simple aggregator condenses the spending of each category per month.
Database
In my toy project, I simply used CSV files for data storage. I followed medallion architecture to organize my data:
| Layer | Schema |
|---|---|
| Bronze | As is from CIBC, Amex, Scotia bank statement downloads |
| Silver (Normalized) | Parsed, Normalized, Deduped into standard transactions schema |
| Silver (Enriched) | Standard transactions schema with an additional column of business logic based expense category. Think of it as enriched data |
| Gold | Aggregation of expense by month + category |
The Gold layer is readily available to be presented to the user and offer MoM expense insights I was looking for. At the same time, this sort of organizing data allows to expand to more use cases (anomaly detection, merchant level analysis etc) starting from the same Silver layer. My understanding of Medallion architecture is - Bronze is very wide and diverse, a reflection of wide variety of data input sources. Gold is also wide and diverse, a reflection of data use cases. Whereas Silver is the source of truth and expected to be very dense, the schema here closely resembles the business objects.
Interestingly, medallion architecture closely resembles three tiered architecture of standard backend service.
View Model (Gold) <-> Domain (Silver) <-> DAO (Bronze)
Service layer + UI
The way the expense report is consumed is through monthly pdf attachment sent in the email to me and my partner. So the service layer in this project constructs pdf and sends emails once a month. But one can imagine more complex use cases that demand a typical web server, and maybe even a transactional database, say we want to support user corrections of expense category.
You may have noticed that I skipped out Relevance Engine component in my mapping, since the data and use case I was building for is very simple it doesn’t warrant any fancy algorithms. However, I think it is a whole interesting domain on its own and I hope to build few projects that illustrate the wide space of these algorithms!!
Finally, here is how my expense report looks.